American River College Integrated Planning System Reports
What are Department Set Standards and Stretch Goals?
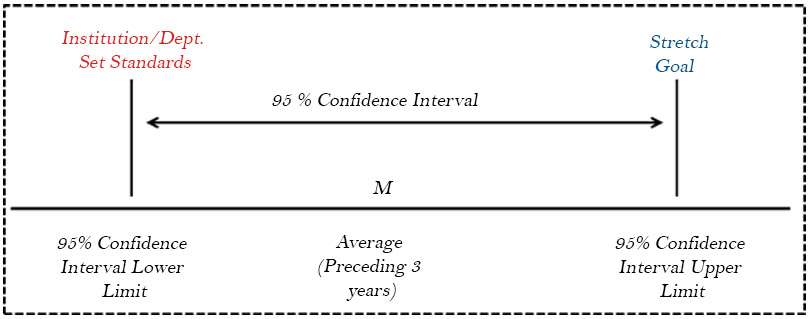
Department Set Standards (DSS) and Stretch Goals are statistical criteria used to detect if a decline or an increase in course success rates has occurred for the department as a whole for the most recent academic year compared to the preceding 3 year average (See Figure 1. below). Falling below the Department Set Standard indicates a statistically significant decline in course success rates has occurred. By contrast, scoring above the stretch goal indicates a statistically significant increase in course success rates has occurred. Finally, scoring in between the Department Set Standard and the Stretch Goal indicates that no statistically significant changes have occurred.
Note: This process does NOT include "department to department" or "department to college" comparisons.
Figure 1. 95% Confidence Interval centered around the Average (M) of the preceding 3 years
Why are we being asked to review and report on Department Set Standards and Stretch Goals?
Reviewing current year results against Department Set Standards (minimum standards) and Stretch Goals (aspirational goals) may be useful in promoting and informing departmental dialogue, planning, decision making, and resource allocation.
In addition, ACCJC standards requires colleges to demonstrate that results are reviewed against these set standards and stretch goals. The process for setting standards and stretch goals was reviewed by the Academic Senate (in 2016 for Department Set Standards, in 2018 for Stretch Goals).
Sacramento Regional Public Safety Training Center
| Discipline | Year 1 - (2017 - 2018) | Year 2 - (2018 - 2019) | Year 3 - (2019 - 2020) | 3 Year Average | Department Set Standard and Stretch Goal Based on Prior 3 Years | Target Year - 2020 - 2021 | Meets Department Set Standard? |
|---|---|---|---|---|---|---|---|
| SRPSTC | 91.3% (N=5005) | 96.3% (N=4223) | 97.7% (N=3081) | 95.10% | 86.8% - 103.3% * | 93.2% (N=2440) | Yes |
Success Rate Percentage
# of A, B, C, Cr, P grades expressed as a % of total grade notations (includes W's but only those occurring after the Drop-No-W Date).
Enrollment (N)
Count of total enrollments (e.g., a student taking five classes is counted five times).
*The Department Set Standard is computed using the department's own course success rates over the previous 3 years (excluding summers). Specifically, A 95% Confidence Interval is constructed around the department's average course success rates over the previous 3 years. The Lower Limit of this Confidence Interval is then used as the Department Set Standard (assumes a t distribution with 2 degrees of freedom (average - (Standard Error * 4.303))). This methodology ensures that falling below the standard is unlikely to occur due simply to random year to year variation but instead is likely to reflect an actual decrease in course success rates for the target year. Stretch goals are computed utilizing the same methodology, but utilizes the Upper Limit of the Confidence Interval (assumes a t distribution with 2 degrees of freedom (average + (Standard Error * 4.303))). Exceeding the stretch goal is likely to reflect an actual increase in course success rates for the target year. Note: Due to methodological limitations, it is possible for the calculated stretch goal to sometimes exceed 100% in cases where there is large variability in course success rates over the previous three years. In such cases, the planning unit is encouraged to set its own internal stretch (aspirational) goals.
Summer semester data are typically excluded due to a variety of factors (e.g., proportion of university students) which differentiate these students from the traditional fall and spring student populations.
[As per the faculty contract, course success rate data should in no way be used as a part of Faculty Peer Review.]
| Course | Year 1 - (2017 - 2018) | Year 2 - (2018 - 2019) | Year 3 - (2019 - 2020) | 3 Year Average | Department Set Standard and Stretch Goal Based on Prior 3 Years | Target Year - 2020 - 2021 | Meets Department Set Standard? |
|---|---|---|---|---|---|---|---|
| FIRE 1500 | 79.2% (N=53) | 91.7% (N=109) | 95.6% (N=90) | 88.80% | 67.7% - 110.0% * | 95.5% (N=66) | Yes |
| FIRE 1501 | 100.0% (N=55) | N/A | N/A | 100.00% | N/A - N/A * | N/A | N/A |
| FIRE 1502 | 100.0% (N=56) | N/A | N/A | 100.00% | N/A - N/A * | N/A | N/A |
| FIRE 1506 | N/A | N/A | 95.7% (N=46) | 95.70% | N/A - N/A * | N/A | N/A |
| FIRE 1571 | 100.0% (N=25) | N/A | N/A | 100.00% | N/A - N/A * | N/A | N/A |
| FIRE 1723 | 50.7% (N=670) | 48.9% (N=180) | N/A | 49.80% | N/A - N/A * | 55.2% (N=281) | N/A |
| FIRE 1760 | N/A | 100.0% (N=24) | N/A | 100.00% | N/A - N/A * | N/A | N/A |
| FIRE 1766 | N/A | 100.0% (N=24) | N/A | 100.00% | N/A - N/A * | N/A | N/A |
| PSTC 1251 | 100.0% (N=50) | N/A | 100.0% (N=27) | 100.00% | N/A - N/A * | 100.0% (N=16) | N/A |
| PSTC 1270 | 95.6% (N=68) | 96.7% (N=123) | 94.6% (N=56) | 95.70% | 93.0% - 98.3% * | 91.8% (N=49) | No |
| PSTC 1273 | 99.0% (N=105) | 100.0% (N=104) | 97.1% (N=69) | 98.70% | 95.0% - 102.4% * | 100.0% (N=63) | Yes |
| PSTC 1500 | 76.4% (N=144) | N/A | 83.9% (N=56) | 80.20% | N/A - N/A * | 86.7% (N=60) | N/A |
| PSTC 1501 | 98.1% (N=262) | 96.3% (N=294) | 93.6% (N=202) | 96.00% | 90.3% - 101.6% * | 94.1% (N=237) | Yes |
| PSTC 1502 | 96.1% (N=233) | 97.2% (N=216) | 91.7% (N=84) | 95.00% | N/A - N/A * | N/A | N/A |
| PSTC 1504 | 74.2% (N=31) | 90.0% (N=30) | 69.2% (N=26) | 77.80% | N/A - N/A * | N/A | N/A |
| PSTC 1505 | 100.0% (N=12) | 100.0% (N=14) | N/A | 100.00% | N/A - N/A * | N/A | N/A |
| PSTC 1506 | 67.9% (N=53) | 79.7% (N=59) | 80.0% (N=65) | 75.90% | 58.8% - 92.9% * | 90.6% (N=64) | Yes |
| PSTC 1514 | 100.0% (N=26) | N/A | N/A | 100.00% | N/A - N/A * | N/A | N/A |
| PSTC 1517 | 100.0% (N=26) | N/A | N/A | 100.00% | N/A - N/A * | N/A | N/A |
| PSTC 1520 | 100.0% (N=150) | 99.3% (N=145) | 100.0% (N=87) | 99.80% | 98.8% - 100.8% * | 100.0% (N=84) | Yes |
| PSTC 1521 | 100.0% (N=58) | 100.0% (N=111) | 100.0% (N=72) | 100.00% | 100.0% - 100.0% * | 98.1% (N=52) | No |
| PSTC 1533 | 96.4% (N=110) | 100.0% (N=66) | 100.0% (N=65) | 98.80% | 93.6% - 104.0% * | 100.0% (N=28) | Yes |
| PSTC 1542 | 100.0% (N=24) | 96.3% (N=27) | 100.0% (N=59) | 98.80% | N/A - N/A * | N/A | N/A |
| PSTC 1555 | 98.4% (N=62) | 100.0% (N=77) | 100.0% (N=36) | 99.50% | N/A - N/A * | N/A | N/A |
| PSTC 1571 | 100.0% (N=94) | 100.0% (N=97) | 100.0% (N=121) | 100.00% | 100.0% - 100.0% * | 100.0% (N=17) | Yes |
| PSTC 1572 | 100.0% (N=31) | 100.0% (N=63) | 98.0% (N=99) | 99.30% | 96.4% - 102.2% * | 100.0% (N=26) | Yes |
| PSTC 1573 | 100.0% (N=65) | 100.0% (N=67) | 100.0% (N=62) | 100.00% | 100.0% - 100.0% * | 100.0% (N=27) | Yes |
| PSTC 1602 | 96.5% (N=85) | 96.4% (N=55) | 95.9% (N=49) | 96.30% | 95.5% - 97.0% * | 100.0% (N=43) | Yes, and exceeds Stretch Goal |
| PSTC 1603 | 100.0% (N=21) | 100.0% (N=22) | N/A | 100.00% | N/A - N/A * | N/A | N/A |
| PSTC 1604 | 100.0% (N=125) | 99.0% (N=101) | 97.2% (N=36) | 98.70% | 95.2% - 102.2% * | 100.0% (N=32) | Yes |
| PSTC 1621 | 100.0% (N=25) | 100.0% (N=28) | 88.9% (N=18) | 96.30% | N/A - N/A * | N/A | N/A |
| PSTC 1622 | 100.0% (N=30) | 100.0% (N=24) | 100.0% (N=21) | 100.00% | N/A - N/A * | N/A | N/A |
| PSTC 1640 | 97.7% (N=171) | 98.6% (N=211) | 98.5% (N=136) | 98.30% | 97.0% - 99.5% * | 98.6% (N=145) | Yes |
| PSTC 1645 | 95.2% (N=62) | 93.8% (N=81) | 100.0% (N=26) | 96.30% | 88.3% - 104.4% * | 97.1% (N=35) | Yes |
| PSTC 1650 | 100.0% (N=71) | 100.0% (N=15) | 100.0% (N=33) | 100.00% | 100.0% - 100.0% * | 100.0% (N=51) | Yes |
| PSTC 1651 | 100.0% (N=30) | 100.0% (N=55) | 100.0% (N=31) | 100.00% | 100.0% - 100.0% * | 98.1% (N=53) | No |
| PSTC 1654 | 100.0% (N=20) | N/A | N/A | 100.00% | N/A - N/A * | N/A | N/A |
| PSTC 1660 | 100.0% (N=28) | 100.0% (N=29) | 100.0% (N=51) | 100.00% | N/A - N/A * | N/A | N/A |
| PSTC 1661 | 100.0% (N=8) | 100.0% (N=14) | 100.0% (N=7) | 100.00% | N/A - N/A * | N/A | N/A |
| PSTC 1663 | 100.0% (N=21) | 100.0% (N=16) | 100.0% (N=19) | 100.00% | N/A - N/A * | N/A | N/A |
| PSTC 1683 | 99.6% (N=275) | 99.7% (N=314) | 100.0% (N=196) | 99.80% | 99.3% - 100.3% * | 100.0% (N=578) | Yes |
| PSTC 1684 | 100.0% (N=540) | 100.0% (N=369) | 100.0% (N=357) | 100.00% | 100.0% - 100.0% * | 100.0% (N=196) | Yes |
| PSTC 1720 | 100.0% (N=97) | 100.0% (N=149) | 100.0% (N=122) | 100.00% | 100.0% - 100.0% * | 100.0% (N=14) | Yes |
| PSTC 1722 | 100.0% (N=122) | 100.0% (N=215) | 100.0% (N=85) | 100.00% | N/A - N/A * | N/A | N/A |
| PSTC 1729 | 100.0% (N=10) | N/A | N/A | 100.00% | N/A - N/A * | N/A | N/A |
| PSTC 1760 | 100.0% (N=24) | 100.0% (N=16) | N/A | 100.00% | N/A - N/A * | N/A | N/A |
| PSTC 1761 | 100.0% (N=24) | N/A | 100.0% (N=19) | 100.00% | N/A - N/A * | N/A | N/A |
| PSTC 1781 | 100.0% (N=81) | 100.0% (N=78) | 97.0% (N=33) | 99.00% | N/A - N/A * | N/A | N/A |
| PSTC 1800 | 100.0% (N=147) | 100.0% (N=75) | 100.0% (N=103) | 100.00% | 100.0% - 100.0% * | 100.0% (N=28) | Yes |
| PSTC 1801 | 100.0% (N=151) | 100.0% (N=146) | 100.0% (N=71) | 100.00% | 100.0% - 100.0% * | 100.0% (N=87) | Yes |
| PSTC 1804 | 100.0% (N=63) | 100.0% (N=38) | 100.0% (N=46) | 100.00% | N/A - N/A * | N/A | N/A |
| PSTC 1812 | 100.0% (N=56) | 100.0% (N=52) | 98.2% (N=57) | 99.40% | N/A - N/A * | N/A | N/A |
| PSTC 1813 | 100.0% (N=60) | 96.2% (N=53) | 100.0% (N=26) | 98.70% | 93.3% - 104.2% * | 100.0% (N=29) | Yes |
| PSTC 1814 | 100.0% (N=18) | 100.0% (N=17) | 100.0% (N=27) | 100.00% | N/A - N/A * | N/A | N/A |
| PSTC 1852 | 100.0% (N=42) | 97.9% (N=48) | 100.0% (N=18) | 99.30% | N/A - N/A * | N/A | N/A |
| PSTC 1874 | 100.0% (N=63) | 100.0% (N=79) | 100.0% (N=52) | 100.00% | 100.0% - 100.0% * | 100.0% (N=30) | Yes |
| PSTC 1900 | 100.0% (N=72) | 98.9% (N=90) | 100.0% (N=120) | 99.60% | 98.0% - 101.2% * | 100.0% (N=49) | Yes |